
Your Biological Age Report Card: 10 Biomarkers That Reveal If You’re Aging Faster Than Your Years

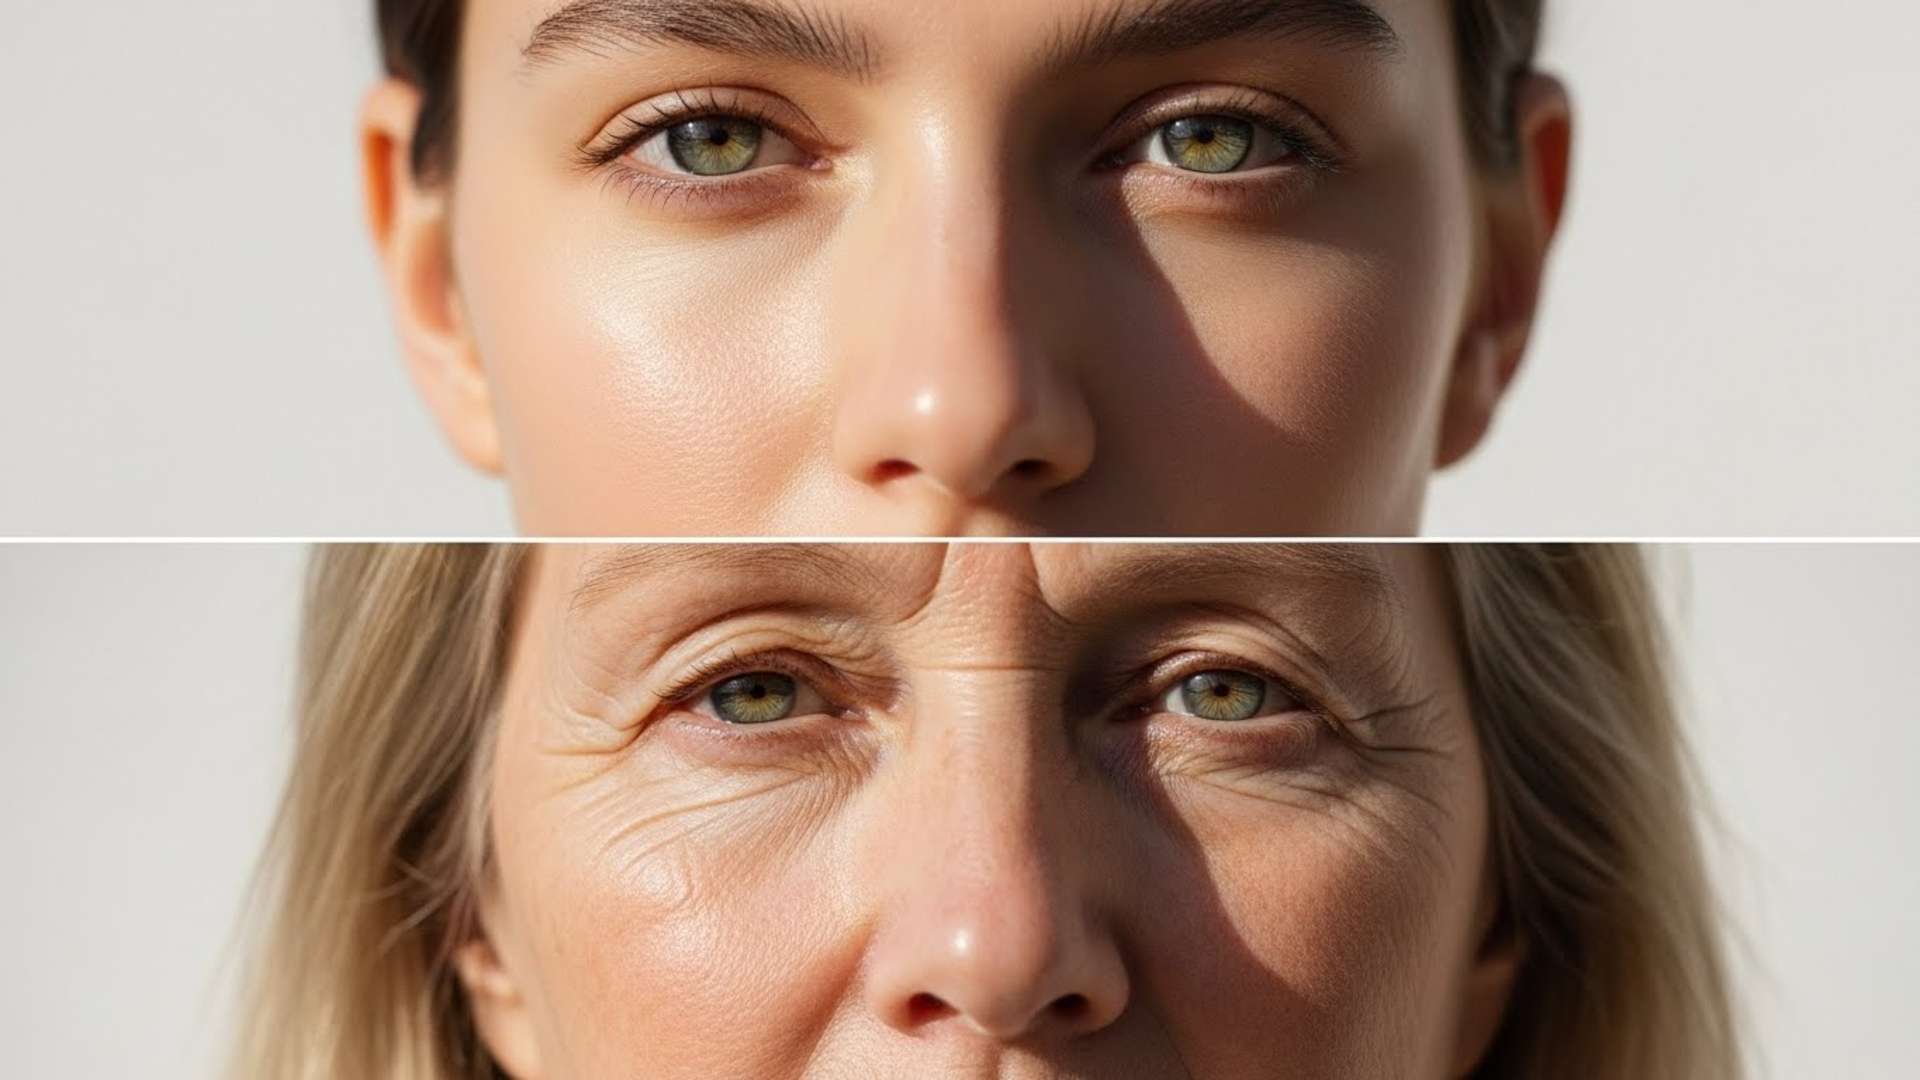
You know that moment at a high school reunion? You look around the room and see two people who were born in the same year, maybe even the same month. One looks like they just stepped off a hiking trail—vibrant, sharp, energetic. The other looks… tired. Like they’ve lived three lifetimes in the span of one.
We’ve all seen it. And honestly, it’s the clearest proof we have that time and biology are not the same thing.
For a long time, we treat age like a simple math problem: Current Year minus Birth Year equals Age. But that number—your Chronological Age—is just a measure of how many times you’ve orbited the sun. It tells us nothing about how well your engine is running.
What really matters is your Biological Age. This is the speed at which your body is actually aging on the inside. It’s the difference between a 50-year-old who is training for a marathon and a 50-year-old who gets winded walking to the mailbox.
Here’s the good news—and I mean really good news: It’s not all genetic. We used to think aging was a lottery, but recent genetic data suggests only accounting for about 15% to 25% of how long you live. The other 75%? That’s on us. It’s the “exposome”—your lifestyle, your environment, and the choices you make every single day.
1. Grip Strength
Aim for 1.5 min (Men) or 1 min (Women).
| Age | Men (Strong >) | Women (Strong >) |
|---|---|---|
| 30-34 | 55.8 kg | 35.3 kg |
| 40-44 | 55.3 kg | 32.7 kg |
| 50-54 | 50.7 kg | 31.9 kg |
| 60-64 | 48.0 kg | 31.0 kg |
| 70+ | 35.1 kg | 24.5 kg |
2. Gait Speed
Target: > 1.0 meter/second.
Calculation: 4 meters / seconds = speed.
| Speed (m/s) | Status |
|---|---|
| > 1.0 | Green: Super-Ager |
| 0.8 – 1.0 | Yellow: Moderate Risk |
| < 0.8 | Red: High Risk |
3. The Sit-Rising Test
Start with 10 points. Subtract 1 point for every support used (hand, knee, etc).
| Score 8-10 | Doing Great! |
| Score 0-3 | Danger Zone (High Mortality Risk) |
4. Balance (One-Leg)
| Age | Target Time | Risk Zone (<) |
|---|---|---|
| 18-39 | 43+ sec | 15s |
| 40-49 | 40 sec | 15s |
| 50-59 | 37 sec | 15s |
| 60-69 | 30 sec | 10s |
| 70+ | 15-20 sec | 5s |
5. Waist-to-Hip Ratio
| Group | Excellent | High Risk |
|---|---|---|
| Men | ≤ 0.90 | > 1.00 |
| Women | ≤ 0.85 | > 0.85 |
6. Leg Power (Chair Stand)
| Age | Men (Avg) | Women (Avg) |
|---|---|---|
| 60-64 | 14-19 | 12-17 |
| 65-69 | 12-18 | 11-16 |
| 70-74 | 12-17 | 10-15 |
| 80-84 | 10-15 | 9-14 |
The “Output” Measures
Let’s start with the stuff you can feel. These aren’t just exercises; they are interrogations of your body’s structural integrity.
1. Grip Strength: It’s Not About the Handshake
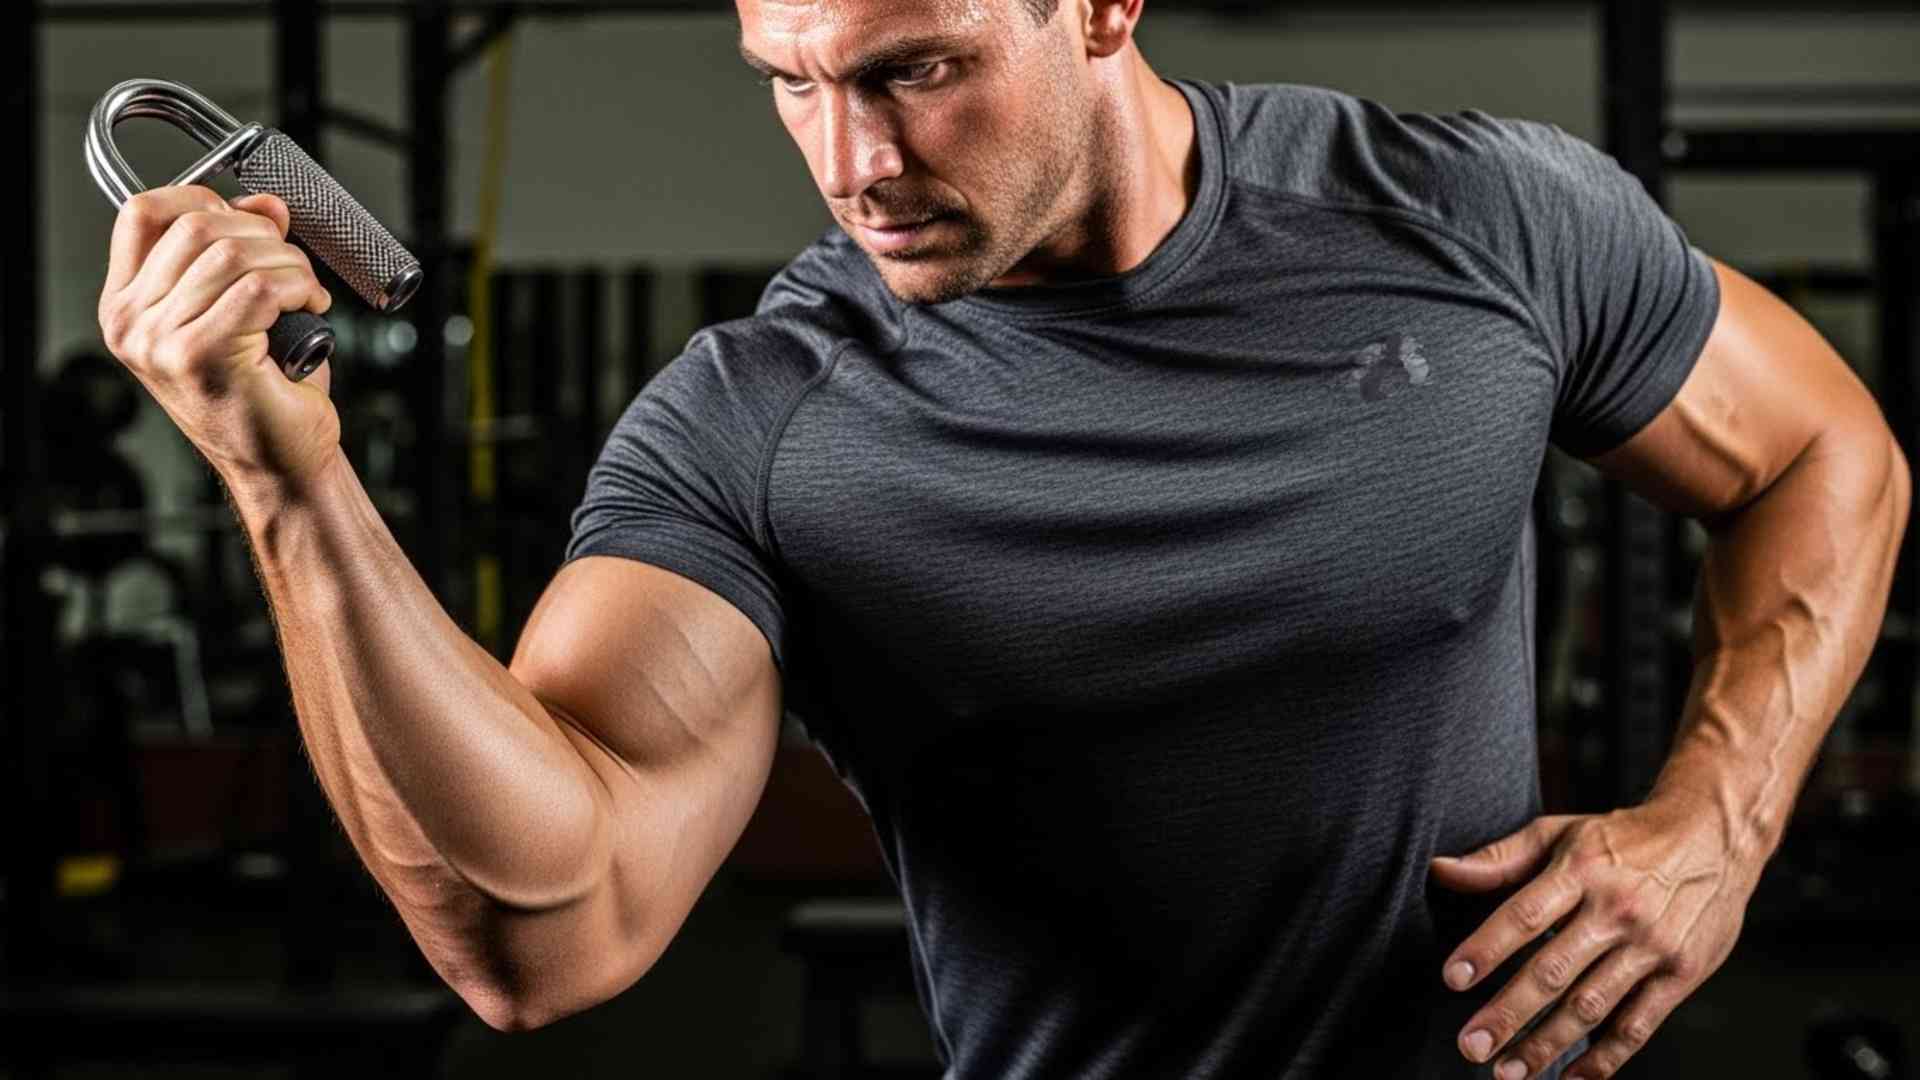
Honestly, this one surprised me the first time I dug into the research. Why does it matter how hard you can squeeze?
It turns out, grip strength is a “proxy” for your overall vitality. It measures “neural drive”—how well your nervous system talks to your muscles. If your grip is weak, it’s like having a bad Wi-Fi signal between your brain and your body.
Dr. Peter Attia, a longevity expert, puts it bluntly: grip strength is “strongly and inversely associated with dementia.” Meaning, the weaker your grip, the higher your risk of losing cognitive function. A study of 40,000 people showed that a strong grip correlates with more gray matter in the brain.
The Test: Ideally, use a dynamometer (they are cheap online). If you don’t have one, try the “Dead Hang.” Can you hang from a pull-up bar for 1.5 minutes (men) or 1 minute (women)? If not, you’ve got work to do.
Table 1:
Don’t just aim for “normal.” “Normal” in modern society is usually unhealthy. Aim for “Strong.”
| Age Group | Men: Risk Zone (<) | Men: Strong (>) | Women: Risk Zone (<) | Women: Strong (>) |
| 30-34 | < 36.0 kg | > 55.8 kg | < 21.5 kg | > 35.3 kg |
| 40-44 | < 35.5 kg | > 55.3 kg | < 18.9 kg | > 32.7 kg |
| 50-54 | < 32.9 kg | > 50.7 kg | < 18.1 kg | > 31.9 kg |
| 60-64 | < 30.2 kg | > 48.0 kg | < 17.2 kg | > 31.0 kg |
| 70+ | < 21.3 kg | > 35.1 kg | < 14.7 kg | > 24.5 kg |
*Source: NIH Toolbox, European standard data *
2. Gait Speed: The “Sixth Vital Sign”
Doctors check your pulse and blood pressure, but they should probably be watching you walk down the hall. Walking is complicated. It requires your heart, lungs, brain, eyes, and muscles to sync up perfectly. If one system is failing, you slow down.
Geriatricians call gait speed the “sixth vital sign.” The magic number here is 1.0 meter per second. If you walk faster than that naturally, you are likely to live longer. If you drop below 0.8 m/s, your risk of disability skyrockets.
The Test: Mark out 4 meters (about 13 feet). Walk at your normal, comfortable pace. Time it.
- Calculation: 4 meters / seconds = speed in m/s.
Table 2: Gait Speed Zones
*Source: Shirley Ryan AbilityLab *
| Speed (m/s) | Biological Age Status |
| > 1.0 m/s | Green Zone: Healthy Aging / “Super-Ager” |
| 0.8 – 1.0 m/s | Yellow Zone: Moderate Risk |
| < 0.6 – 0.8 m/s | Red Zone: High Risk of Frailty |
3. The Sit-Rising Test: The Floor is Truth

This wasn’t in the original top 10 list, but it’s too important to skip. Developed by Brazilian researchers, the Sitting-Rising Test (SRT) is a brutally honest predictor of mortality.
The Test:
- Stand in comfortable clothes, barefoot.
- Sit down on the floor cross-legged.
- Stand back up. The Catch: You lose a point for every support you use. Hands on knees? Minus 1. Hand on floor? Minus 1. Knee on floor? Minus 1.
You start with 10 points (5 for sitting, 5 for standing).
- Score 8-10: You’re doing great.
- Score 0-3: This is the danger zone. One study found people in this range were 5 to 6 times more likely to die over the next 6 years compared to high scorers.
It measures flexibility, balance, and pure leg power in one go.
4. Balance: The One-Leg Stand

We take balance for granted until we lose it. But balance is like a tripod: it relies on your eyes, your inner ears, and the nerves in your feet. As we age, the “tripod” gets wobbly.
A recent Mayo Clinic study identified the one-leg stand as the single most telling measure of aging, showing a steeper decline with age than even grip strength.
The Test: Stand on one leg, eyes open, hands on hips or by your side. Don’t hook your foot behind the other leg.
Table 3: One-Leg Stand Norms (Eyes Open)
*Source: Springer et al., Mayo Clinic *
| Age Group | Target Time | The “Oh No” Threshold |
| 18-39 | 43+ seconds | < 15s |
| 40-49 | 40 seconds | < 15s |
| 50-59 | 37 seconds | < 15s |
| 60-69 | 30 seconds | < 10s (High Fall Risk) |
| 70+ | 15-20 seconds | < 5s |
5. Waist-to-Hip Ratio: The Shape of Stress
Forget BMI for a second. BMI is flawed because it doesn’t know if you’re carrying muscle or fat. What matters is where the fat is.
Visceral fat—the hard fat stored deep in your belly—is nasty stuff. It’s biologically active, pumping out inflammatory chemicals. It’s often called “Cortisol Belly” because stress hormones tell your body to park fat there for quick energy usage during “danger” (which, in modern life, is usually just an overflowing email inbox).
The Test: Measure your waist (at the belly button) and your hips (at the widest part). Divide Waist by Hip.
Table 4: The Risk Zones
*Source: WHO, NIDDK *
| Loan | Excellent (Low Risk) | Moderate Risk | High Risk (Apple Shape) |
| Yeast | 0.90 or less | 0.91 – 0.99 | > 1.00 |
| Loan | 0.85 or less | 0.81 – 0.84 | > 0.85 |
6. Leg Power: The 30-Second Chair Stand
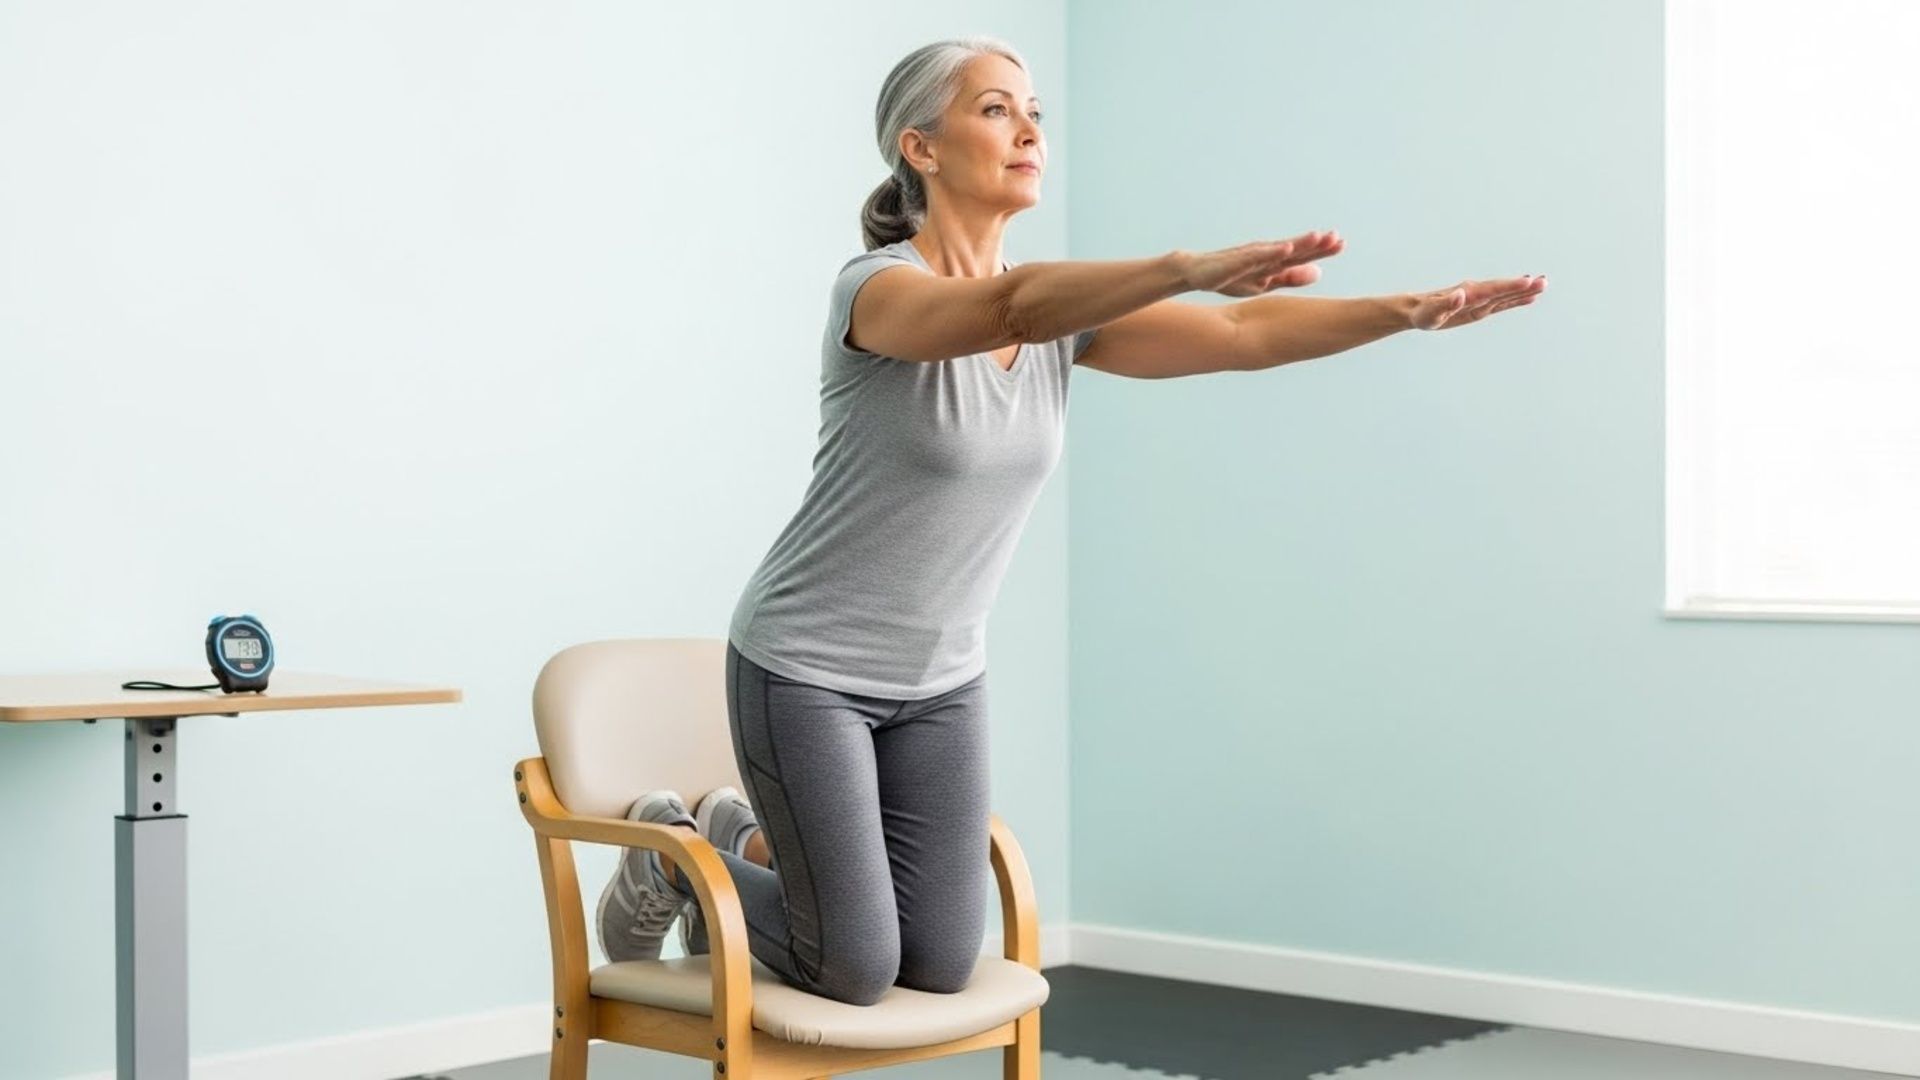
We lose power (speed + strength) faster than we lose just raw strength. This test tells you if you’ll be able to get out of a car or off the toilet when you’re 90.
The Test: Sit in a chair. Arms crossed over chest. Stand up fully, sit down fully. Repeat for 30 seconds. Count your reps.
Table 5: Leg Power Norms (Reps)
*Source: CDC STEADI *
| Age Group | Men (Avg) | Women (Avg) | Risk Zone (<) |
| 60-64 | 14-19 | 12-17 | < 14 (Men) / < 12 (Women) |
| 65-69 | 12-18 | 11-16 | < 12 (Men) / < 11 (Women) |
| 70-74 | 12-17 | 10-15 | < 12 (Men) / < 10 (Women) |
| 80-84 | 10-15 | 9-14 | < 10 (Men) / < 9 (Women) |
The Internal Report Card: What’s in Your Blood?
The “Input” Measures
Now we look under the hood. These biomarkers tell us about the environment your cells are living in.
1. Resting Heart Rate (RHR): The Engine Idle

Think of your heart like an engine. If it’s idling at 9000 RPMs while parked, it’s going to wear out faster. A lower RHR generally means your heart is efficient and your nervous system is chill (parasympathetic dominance).
Table 6: Resting Heart Rate Targets
Source: AHA, WHOOP9
| Status | Men (bpm) | Women (bpm) | What it means |
| Athlete | 49 – 55 | 54 – 60 | Cooper Efficient |
| Longevity Target | 56 – 61 | 61 – 65 | Good Vagal Tone |
| Normal (Average) | 62 – 70 | 66 – 73 | Standard Aging |
| Not Zone | > 80 | > 85 | Systemic Stress |
2. Blood Pressure: The “Silent” Pipe Burster

You know the drill: 120/80 is the goal. But here is something most people don’t know: you can train your blood vessels.
The Hack: Isometric Handgrip Training.
Research has shown that doing isometric grip exercises (squeezing a dynamometer at 30% effort for 2 minutes, 4 times, with breaks) can lower systolic blood pressure significantly. It works by improving the flexibility of your blood vessels (endothelial function). It’s like yoga for your arteries.
Table 7: Blood Pressure Categories (2024 Standards)
Source: AHA/ACC11
| Class | Systolic (Top) | Diastolic (Bottom) |
| Optimal | < 120 | < 80 |
| Elevated | 120 – 129 | < 80 |
| Stage 1 | 130 – 139 | 80 – 89 |
| Stage 2 | ≥ 140 | ≥ 90 |
3. HbA1c: Are You “Caramelizing”?

This is my favorite analogy for patients. You know what happens when you roast onions? They brown and caramelize. That’s sugar binding to protein under heat.
The exact same thing happens in your body. It’s called glycation. Sugar binds to your hemoglobin (and other proteins), making them stiff and sticky. HbA1c measures how much of your blood is “caramelized” over a 3-month period.
You want to be slow-cooking, not deep-frying.
Table 8: HbA1c & Aging
*Source: ADA, Siphox Health *
| HbA1c | Status | Biological Age Impact |
| < 5.2% | Optimal | Slow “cooking,” preserving tissues. |
| 5.3% – 5.6% | Normal | Standard aging. |
| 5.7% – 6.4% | Prediabetes | Accelerated aging (“simmering”). |
| ≥ 6.5% | di | Rapid aging (“boiling”). |
4. hs-CRP: The Silent Fire

Inflammation is the buzzword of the decade, and for good reason. “Inflammaging” is the chronic, low-grade fire that burns down your house (body) over decades. High-sensitivity CRP (hs-CRP) measures the smoke from that fire.
If your hs-CRP is high, your body is fighting something —maybe belly fat, maybe gum disease, maybe stress. Whatever it is, it’s distracting your immune system from repairing your DNA.
- Target: You want this below 1.0 mg/L.
- Warning: Above 3.0 mg/L indicates high cardiovascular risk.
5. Lipid Ratio: The Garbage Trucks

Total cholesterol tells you almost nothing. You need to look at the ratio of Total Cholesterol to HDL.
HDL is the “garbage truck”—it picks up cholesterol and takes it to the liver to be dumped. LDL is the “delivery truck.” You want enough garbage trucks to handle the deliveries. A ratio under 3.5 is the sweet spot for longevity.
I hear these all the time. Let’s kill them right now so you can move forward.
Myth 1: “My metabolism slowed down because I hit 30.”
The Truth: Nope. A massive study by Herman Pontzer in Science (2021) analyzed 6,000 people and found that human metabolism is actually rock steady from age 20 all the way to age 60.8We gain weight in our 30s because we sit more, stress more, and sleep less—not because the engine broke.
Myth 2: “It’s all genetic.”
The Truth: We covered this, but it bears repeating. 80% is lifestyle. If your parents aged poorly, that’s not a sentence; it’s a warning of what happens if you follow their lifestyle habits.
Myth 3: “I’m too old to start.”
The Truth: Biological age is elastic. You can actually reverse it. Studies on “Centenarian Decathletes”—people training for their 100th year—show that starting resistance training in your 70s or 80s can restore muscle power to levels seen in untreated 50-year-olds.
Need More Help For Measuring These Metrics? Look Into These
Look, you don’t need a PhD or a lab coat to track this stuff. Tracking your biomarkers shouldn’t be a guessing game. While you can do some of these tests with a stopwatch and a bathroom scale, having the right tools makes the data accurate—and let’s be honest, if the tool is fun to use, you’ll actually use it. I’ve rounded up a few affordable gadgets that can turn your living room into a longevity lab. These are products that give you the hard numbers you need to fill out your “report card” so you aren’t just guessing about your health.
1. Digital Hand Dynamometer:

This is the gold standard for the Grip Strength test we talked about. It gives you a precise digital reading in kg or lbs so you can track your “neural drive” over time.
2. Smart Body Tape Measure:

Forget fumbling with a loose tape measure while trying to suck in your gut. This smart tape connects to an app via Bluetooth, ensuring you get an accurate waist and hip measurement every time to track that critical Waist-to-Hip ratio.
3. Upper Arm Blood Pressure Monitor:
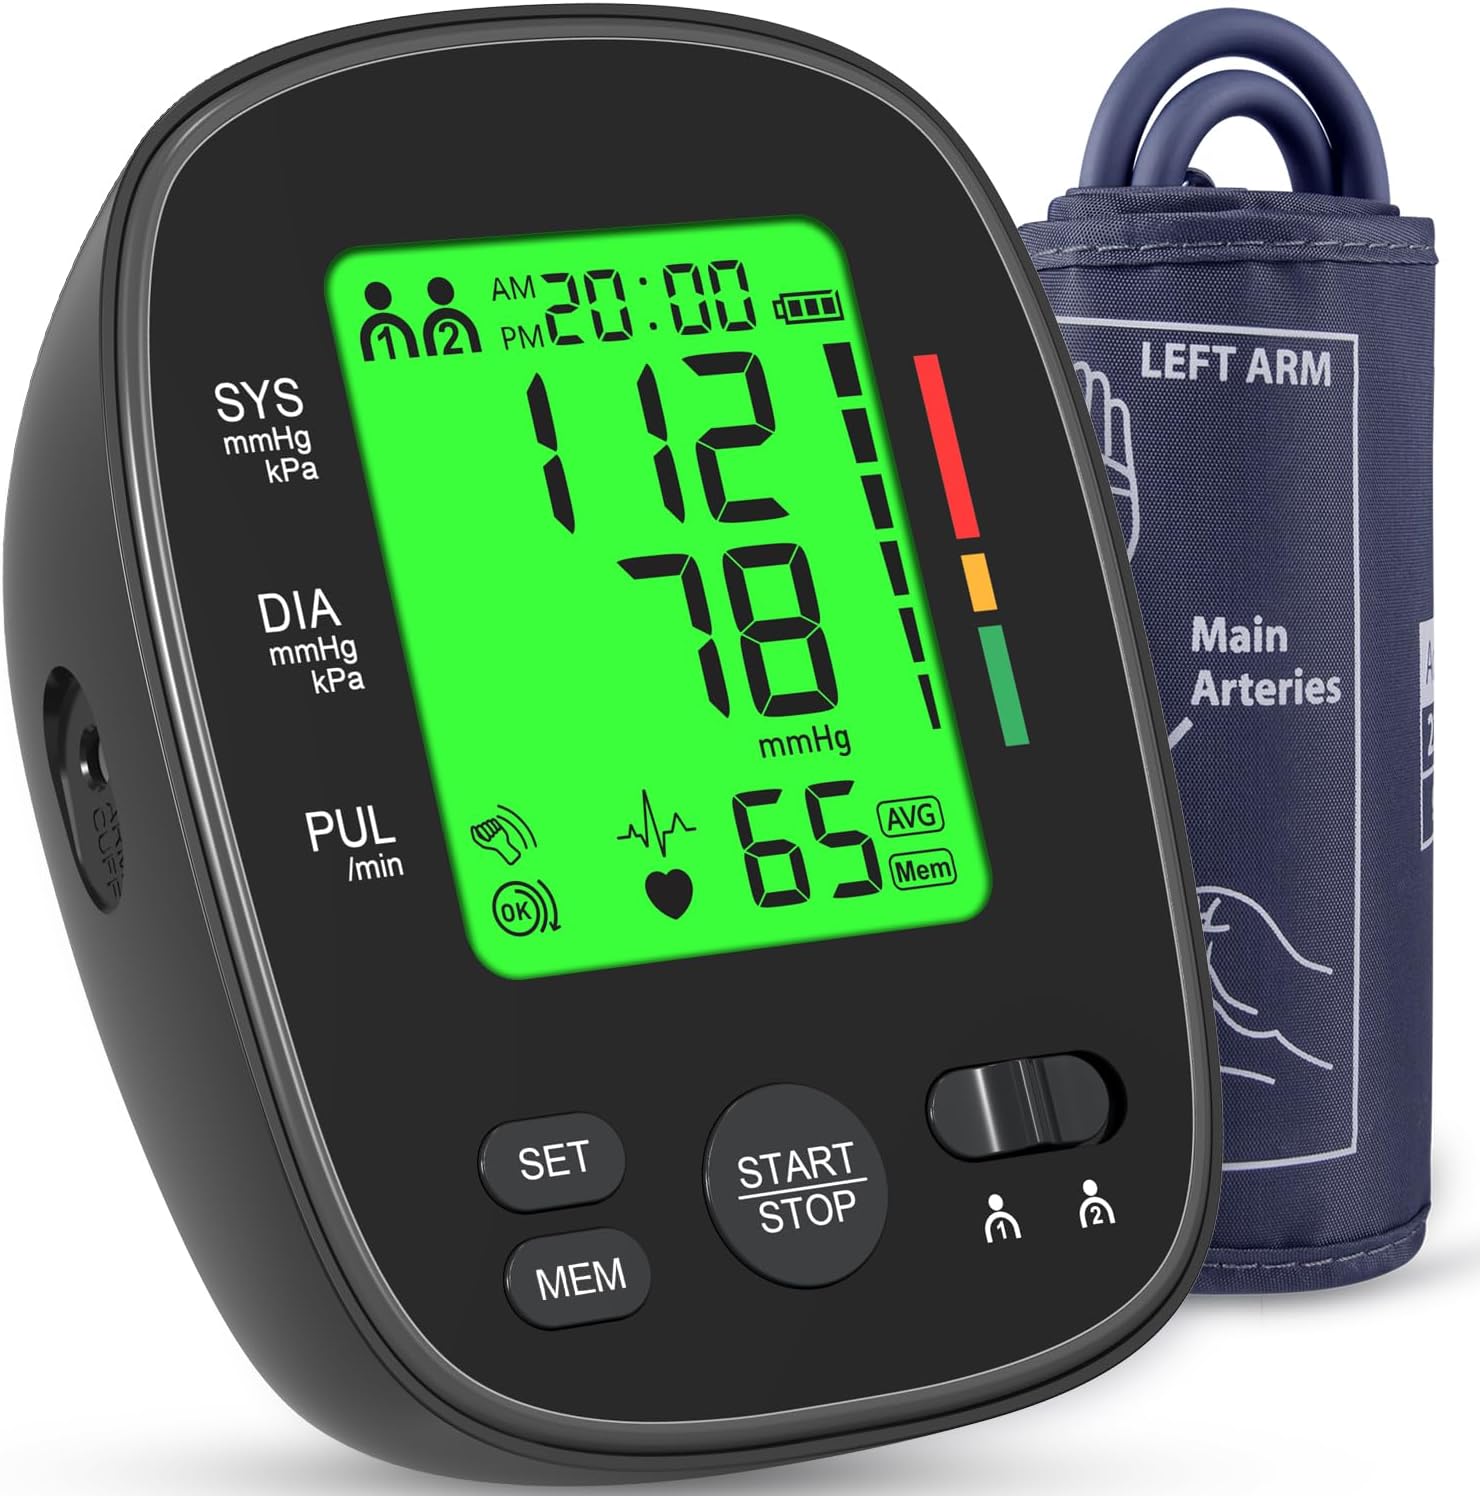
Don’t rely on the machine at the grocery store. Omron is widely considered the clinical standard for home monitoring. This helps you track your “pipe pressure” and Resting Heart Rate accurately in the morning.
4. Balance Pad:

If you find the one-leg stand test easy (or impossible), this is how you train it. Standing on a foam pad destabilizes you, forcing your “tripod” (vision, inner ear, nerves) to work harder. It’s great for retraining stability while watching TV.
5. Doorway Pull-Up Bar:
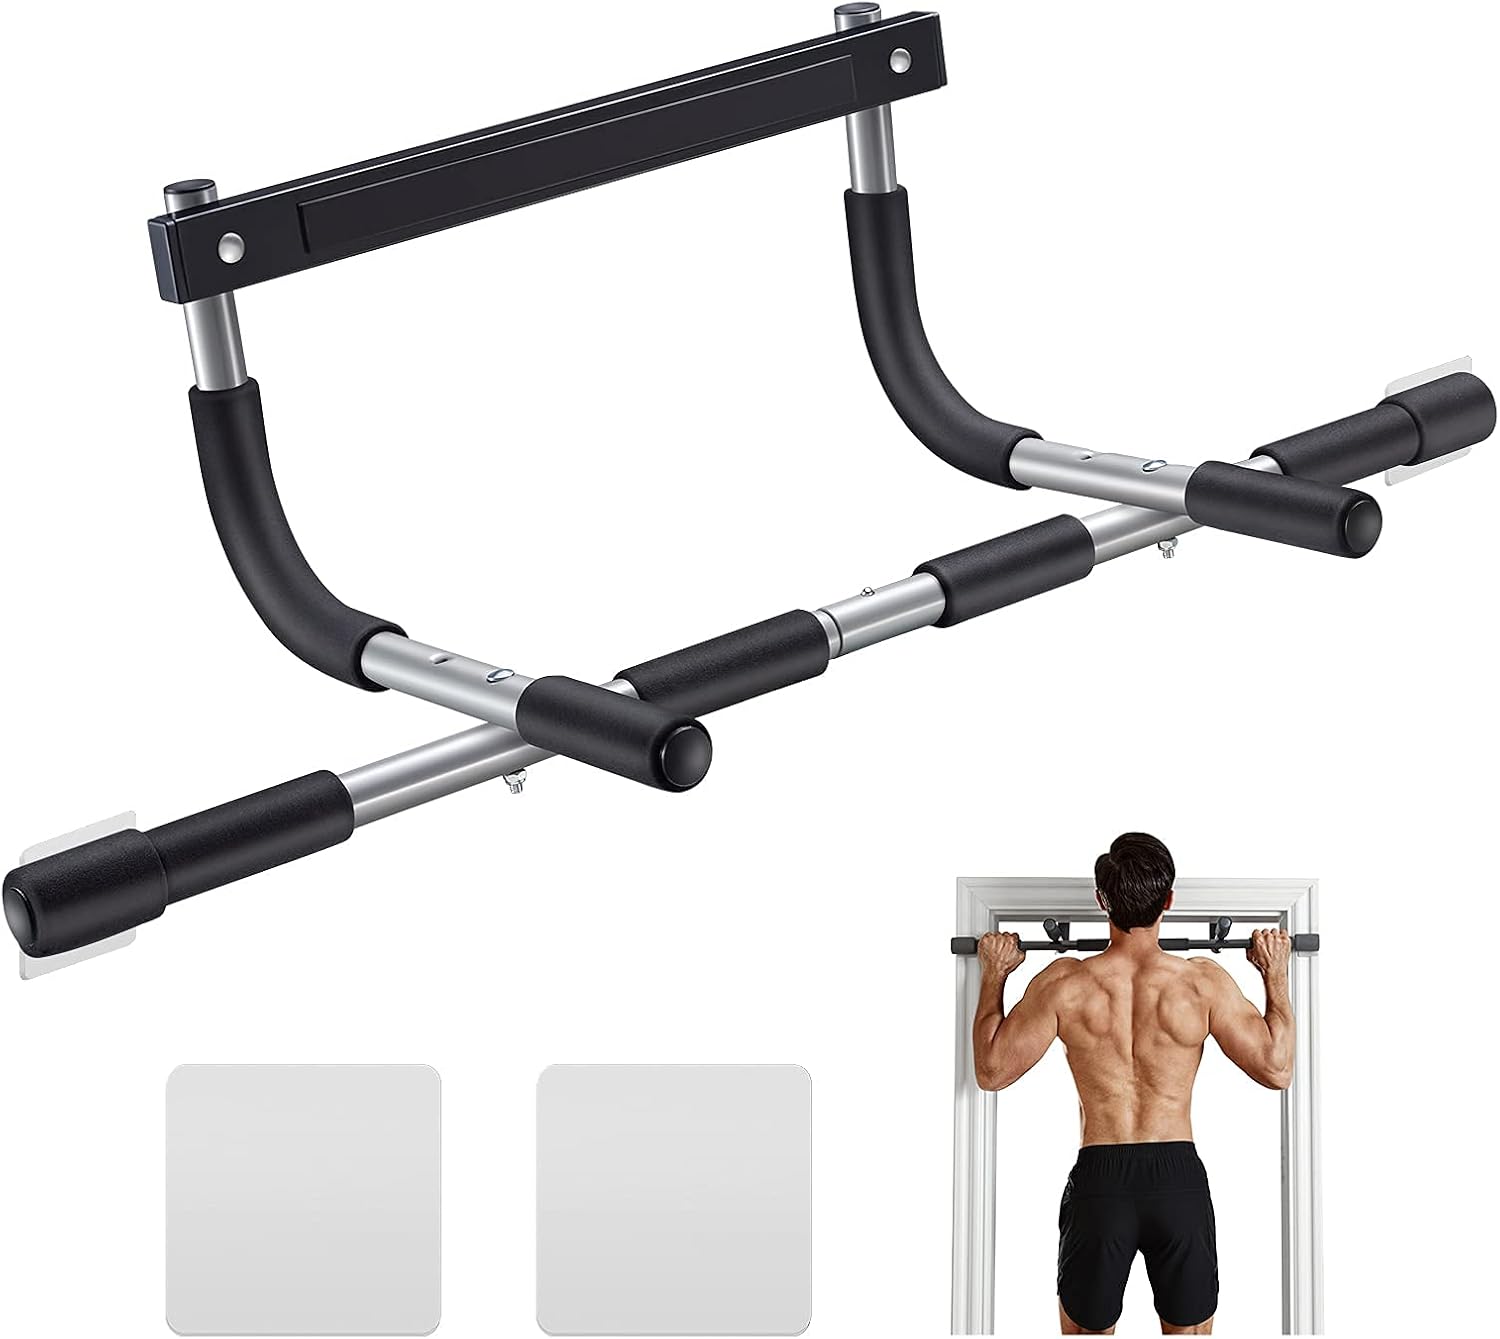
This isn’t just for pull-ups. It’s essential for the “Dead Hang” test and for decompression. Even if you can’t do a pull-up yet, just hanging builds the grip strength that correlates with brain health.